Expert traders believe it could potentially reach 10$ by 2031.
Updated Aug 14, 2025
Dogecoin Price Patterns That Could Signal Your Next Trade
KEY TAKEAWAYS
- Dogecoin is a cryptocurrency that originally started as a joke, but in the last few years evolved into a serious digital currency.
- Technical charts are full of hints and can help you predict the future.
- Traders’ behavior is often influenced by the support and resistance.
- Volume is one of the most trusted ways to confirm the strength of the price move.
- Platforms like Twitter, Reddit, and news websites play a crucial role in spreading news and shaping market sentiments.
Are you a professional trader? Or someone who just loves trading? If yes, then you must have heard of Dogecoin. It has been popular in the world of cryptocurrency because of its fun meme and changing price.
If we look at its best price pattern, it’s a cycle: a price drop, then buying by traders, followed by big price increases. For example, in 2017 dogecoin price went up by more than 2000%, and in 2021, it jumped by an incredible 25,000% (according to AInvest). Who knows, a meme cryptocurrency would go that high, right?
Dogecoin price patterns are quite difficult to understand, but traders can make a lot of money if they know when to buy and sell. After these figures, your curiosity might be triggered. Don’t worry, we brought the solution to it. Dive into this article and learn more about its market, pattern, and movement.
Recognising Common Chart Patterns
Ever heard about humans predicting natural disasters using some patterns like sea animals (especially dolphins), unnatural behaviour, and sudden weather change? In most cases, these are helpful too.
Similarly, the Dogecoin price chart shows different patterns that can help predict future price changes. Some common patterns are bullish flags, double bottoms, cup and handle shapes, and falling wedges, which are like those alarming dolphins that can give you a hint that the price might go up.
But if we look at double tops and rising wedges, this indicates that the price might go down. Knowing about these patterns helps traders, but keep in mind that in the trading world, no fixed pattern can guarantee you success.
Tracking Momentum With Moving Averages
Moving averages help make price changes easier, to see and show the main direction of the trend. Traders often use short-term and long-term averages together to check if an asset is growing stronger or weaker.
For example, if Dogecoin price goes above its 50-day average, it could mean it’s gaining momentum, but if it falls below a longer average, it might indicate a loss of interest or the beginning of the downward trend.
While moving averages help find trends and price levels to watch, they react slowly to changes and should be used with other tools and risk management strategies.
Identifying Support and Resistance Levels
Support and resistance are the key markers of traders’ behaviour. These zones usually form at price levels where the market has changed direction, or stopped before. Knowing these points can help you make a decision on when to buy or sell.
Supporter: A price point where traders usually come in to stop prices from falling further.
Resistance: A price point where the seller emerges, often slowing or reversing price increases.
If you have invested in Dogecoin, then setting alerts and watching for confirmation around these zones can work as a great strategy, especially when paired with other amazing indicators like volume or RSI.
As of now, Dogecoin is in a steady phase; it faces resistance levels between $0.23 and $0.244 and has support levels from $0.235 to $0.238. This small trending range shows that right now the market is waiting for a change, which could significantly lead to Dogecoin’s next price momentum.
Volume as a Confirmation Tool
Volume is a reliable way to check if a price range is strong. If the price goes up and down a lot, while a lot of shares are being traded, it’s more likely to last.
Low-volume breakouts, on the other hand, are likely to give false signals. We will understand this with an example: if the dogecoin price goes up quickly but volume remains low, it could mean that not many people believe in that rise.
On the other hand, if many people are trading in a price increase, it usually means that more traders support that change, making it more believable.
The live Dogecoin price today is $0.223275 USD with a 24-hour trading volume of $2,606,282,827 USD.
Using Charting Tools for Better Trade Setup
To work well with patterns, you need quick and easy access to up-to-date data and tools. Chart trading lets you analyze, plan, and place trades all on one screen. Here are a few steps you can follow:
- Try to identify and learn different chart patterns, like triangles, double tops, and flags.
- Observe the Dogecoin movement and look for a pattern on the chart.
- Once you properly identify the pattern, verify it with key elements like the trendline and volume.
- Try to make your own pattern to predict the future price movement.
- Use a trading strategy based on that pattern.
- Don’t forget to set a stop-loss to limit potential losses in case the pattern fails.
- Monitor the trade, and if you feel that it needs adjustments, then make them.
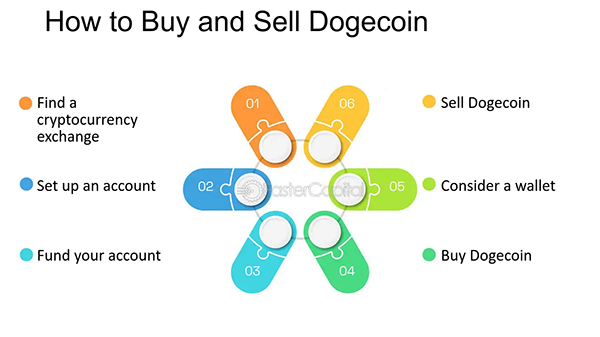
These tips will help you trade in a better way. And if you are wondering how you can buy and sell Dogecoins, here is a chart to explain this question, too:
Watching Market Sentiment and News Triggers
Do you remember the Christian Ronaldo and Coca-Cola incident where he removed two Coca-Cola bottles from view at a press conference? Did you know what happened after that? We will tell you, Coca-Cola lost about 4 billion dollars because of a 1.6% drop in the company’s share price (according to ESPN).
Similarly, if we talk about a positive example, you must have heard about Elon Musk praising Dogecoin on social media, and the price of Dogecoin started moving unstoppably.
News can influence the all over sentiments of investors. Positive news can create bullish sentiments and encourage investors to buy more. Whereas negative news can create bearish sentiment. This can lead to pressure on investors to sell their stocks as soon as possible.
Apart from news, apps like Reddit and Twitter can significantly impact the overall sentiments of investors by spreading news and thoughts of influential figures.
DID YOU KNOW
Elon Musk’s company SpaceX is planning to launch a Dogecoin-funded satellite called DOGE-1 to the moon. So when people say “Doge to the moon,” they actually mean it!
Conclusion
Dogecoin price patterns are helpful tools for traders in the world of cryptocurrency. These patterns show market trends and help traders make better choices. By spotting these patterns, traders can predict when the market changes direction. Knowing Dogecoin chart patterns helps traders handle this unpredictable market well.
Don’t forget elements like volume, sentiments, and momentum because they are equally important, too. And if you are trying your luck and skill in Dogecoin trading, then these factors can make a big difference.
Watch market updates, daily fluctuations in price, and news to make the best out of your investment.
Author - Dushyant K

Finance Writer
Related Posts