QR codes can help businesses in improving data entry by scanning and uploading transition details instantly.
Updated Jul 22, 2026
How Visual Tools Are Revolutionizing Bookkeeping
Key Takeaways
- Visual illustrations make accounts easier by transforming complicated financial data into easy charts, dashboards, and reports, which also reduce errors and improve decision-making.
- QR codes improve accountancy by smooth-running payments, reducing manual data entry errors, and improving bills and record management.
- Graphic designing tools help bookkeepers stay organized by enabling them to create attractive financial reports and infographics for better client communication.
- AI-powered dashboards automate financial tracking, providing real-time updates on cash flow, predictive analytics, and spending patterns.
- Technology is reshaping modern bookkeeping by making financial management faster, smarter, and more accurate with automation and data visualization.

Do you know that companies lose almost 5% of their revenue each year because of financial mismanagement and fraud? Meanwhile, 60% of small business owners feel overwhelmed by bookkeeping tasks, with many others struggling to make sense of these complex spreadsheets and traditional accounting systems. (Source: ACFE & LinkedIn)
But what if we could have a world where financial data is easy to understand and bookkeepers do not have to go through these endless numbers of rows to find something important?
Well, this is the generation of AI, so nothing is impossible. By using automated dashboards, QR code receipts, and interactive visual reports, people can actually manage their finances effectively. These visual tools are making our tracking easy, faster, and smarter.
So, if you are a bookkeeper who wants to know more about using these technologies to stay organized and improve financial performance, get in without any worries!
Why Visuals Work Better for Bookkeeping
We have heard it from our childhoods that it is always easier to understand with visuals rather than texts. Why? Because it simplifies the complex information and makes it edible for us. The same way it helps in bookkeeping also, by making it easier to keep record of finances, track funds, and create reports.
Treasurers can use charts, graphs, and dashboards to see the trends and obvious patterns without scrolling down through long lists of transactions. A study found that presentations with visuals are 43% more persuasive than those without. This transformation of visual approach is improving the way decisions are made while minimizing the errors. (Source: We Are Cognitive)
Fun Fact According to a study, 90% of the information that is processed by the brain is visual. No wonder charts and dashboards make bookkeeping so much easier to understand!
How QR Codes Are Changing the Way Bookkeepers Work
Take Jason, a freelance consultant who used to record his payments from his clients manually for many years, added a QR code to his bills. So his clients now pay him instantly, and the data of transaction is automatically recorded in his accounting software.
QR codes are something we can see anywhere and everywhere nowadays. They are used by shopkeepers, vendors, cab drivers, and who not. But one thing that not everybody is aware of is that it can also be helpful for money management.
The QRs are changing the way bookkeepers work by providing modernized data entry and record keeping. By scanning this QR code, customers can make payments easily; hence no need to keep payment information in hand. It reduces the chances of typing mistakes and helps you keep track of things while saving time and improving accuracy.
Financiers can also use QR codes to improve inventory management, strengthen client relationships, integrate Odoo, and refine spending logs. This feature gives quick and easy access to invoices and other documents while reducing the risk of document loss and unwanted interference.
Why Graphic Design Tools Are Helping Bookkeepers Stay Organized
Graphic designing tools are not used by only designers anymore; they are also becoming important to bookkeepers. These platforms indirectly help them stay organized by supporting interactive communication, managing workflows and projects, leading to better record keeping of finance.
Tools like Canva, Visme, and Adobe Express allow professionals to create attractive financial reports, infographics, and cost allocations with the help of templates that are easily understandable to the clients. For an in-depth analysis of how digital tools are transforming financial reports, check out Revolutionizing Financial Reports with Modern Digital Tools.
Canva’s QR code generator allows people to generate QR codes for bills, financial statements, and payment pages. This process makes the transaction easy and fast, as there is no need for manual data entry after this.
Other tools that help treasurers are:
- Toggl Track to trace the time spent on a project
- HoneyBook for managing contacts and bills
- Asana and Trello for project management
- Adobe Creative Cloud. For design and organization
AI-Powered Dashboards Are Making Bookkeeping Smarter
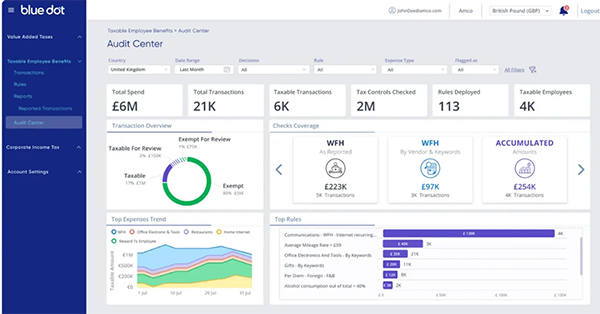
Bookkeeping with AI is no longer a dream. It is taking the finances to the next level by automating repeated tasks and offering current analysis. These AI-powered dashboards blend with accounting software to provide instant updates on financial situations, cash flow patterns, and predictive analytics.
Modern financial management requires a blend of advanced software and expert oversight to ensure long-term stability. While AI-powered dashboards provide the data, professional Pherrus bookkeepers offer the strategic insight necessary to interpret these visuals and turn them into actionable business growth.
Cash keepers can also generate reports with these advanced dashboards easily, as it highlights all your expenditures and spending patterns. It also shows pending bills and predicts future expenses while keeping the past in mind.
The dashboard attractively presents the actual data, which makes it easy for people to understand the financial health at once. Plus, it reduces the chance of human errors as all the calculations are done by AI, which simplifies workflows.
The Challenge: Adopting Visual Tools Without Overcomplicating Things
The benefits of visual illustrations must have become clear to you now, but they also come with their own set of challenges when integrated with accounting processes. One of those major challenges is the adoption of these tools without complicating the other things. However, it can be managed if bookkeepers use the technology while maintaining simplicity in their processes.
Other challenges in adopting these tools are insufficient training, intricacy, data storytelling, data availability, and lack of executive support. But these problems are minor in front of the benefit business can get from it. Also, for some businesses, normal datasheets are enough in that case; people can avoid using these platforms and adding any complexity to their businesses.
The finance sector is developing rapidly, and those who adapt to these new and latest technologies will stay ahead. So stay informed about the latest inventions and predictions in Future Trends in Accounting and Bookkeeping for the Finance Sector.
Sources:
Author - Dushyant K

Finance Writer
Related Posts